v0.3.1 / 2023-02-12
===================
* fix ipv6 address parsing

v0.3 / 2021-03-27
=================
* port to qt5
https://download.opensuse.org/repositories/home:/mxttie:/kdeapps/
TCPView clone for linux
v0.3.1 / 2023-02-12 =================== * fix ipv6 address parsing v0.3 / 2021-03-27 ================= * port to qt5
https://download.opensuse.org/repositories/home:/mxttie:/kdeapps/
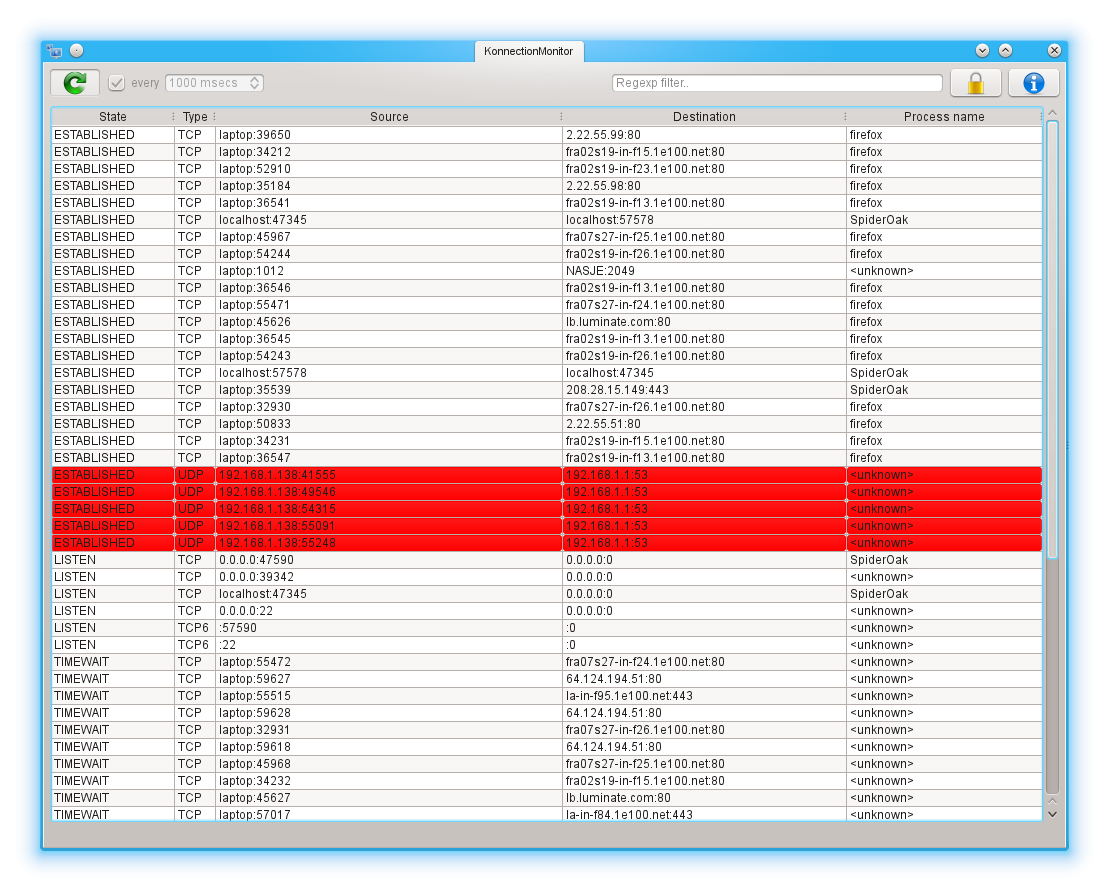
KonnectionMonitor turns out to remain a useful program, so I updated it with IPv6 support. And crossed off a few other todo’s in the meantime. 😉
v0.2 / 2014-08-15
=================
+ ipv6 support
+ show udp connections
* start refresh at startup
+ added filter box
+ sorting by column
+ added icons
+ added about dialog
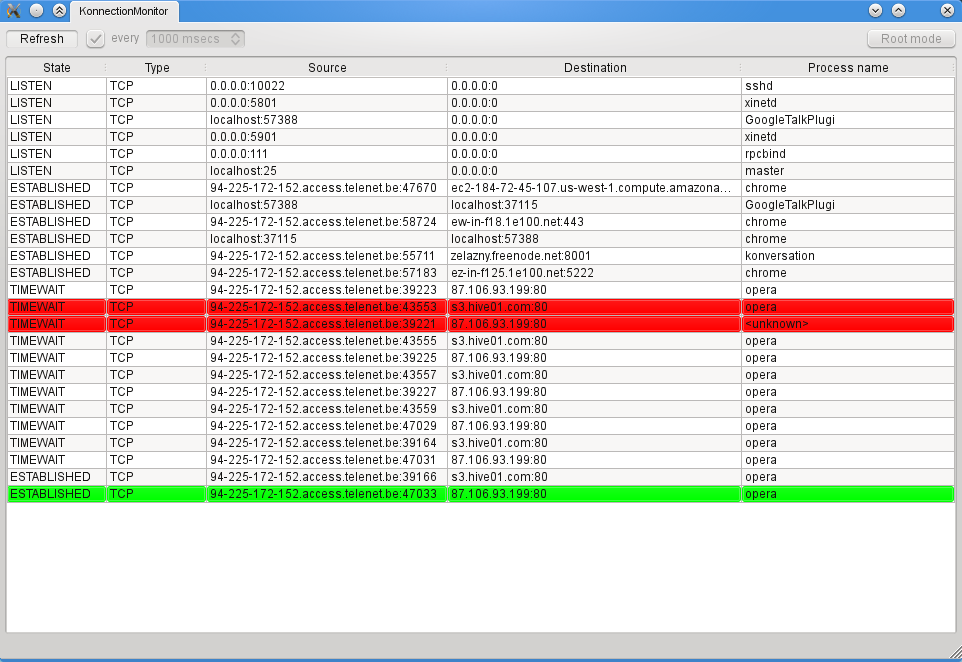
A few years ago, back in 2007 when I started using Linux as my primary operating system, I had a few itches to scratch because I missed my handy windows utility programs I’d become grown to. One of those utilities was TCPView which monitors incoming and outgoing TCP connections.
Hence, a new project was born: KonnectionMonitor. It’s goal was to mimic the TCPView utility on Linux/KDE.
Learning the /proc filesystem, I was amazed how easy it was to write such program. I’m not sure if it is the ideal way, but it works. Packaging seemed less easy though. 🙂 Nowadays we have a fully fledged opensuse build service and kde-apps.org integrating with it which makes publishing your soft a lot easier. I already gained some experience packaging VocTrainer and Telemeter Plasmoid, so it was only a matter of finding time to package this oldy. It’s baptized with the kind of cheesy name KonnectionMonitor which suggests it is built for KDE, but currently there is no KDE dependency present, so feel free to use it bloatingly-free in other desktop environments. 🙂
One remark: if you know TCPView, you will currently miss the close connection command in KonnectionMonitor. I’ve looked into ways on how to implement this on linux and there is no obvious way to do that (there is no api function). The only solution coming close to that, is sniffing the network and sending a RST (reset) packet (which in turn involves some other low level network tricks to be able to send a valid packet to the right host). I’ve already started experimenting with libpcap. It should be doable, stay tuned.
For now, we have version 0.1 which can be downloaded from kde-apps.org. The source is on gitorious.
A few years ago, I wrote a small app showing the open network connections (announcement following shortly). I never figured out how to measure transfer rates over the connections since the kernel does not seem to provide this info through the /proc filesystem (only some data queue length which is related to kernel mem usage).
Today we all know and love iftop, but where does it get that info? Simple: pcap! Out of curiosity, I checked out the libpcap docs to see how hard it would be to get started. Turned out to be pretty simple! There are a few excellent tutorials which get you started real fast. In about half an hour I made this very simple sniffer which accumulates the received bytes and packets per second and prints it out when the second changes. Each line contains the timestamp (sec), KB/s and number of packets received in that second. Here you can see me watching a youtube vid 🙂
Opening device eth0

ts = 1285276934, load = 0.7 KB/s (4)

ts = 1285276935, load = 0.3 KB/s (1)

ts = 1285276939, load = 0.9 KB/s (4)

ts = 1285276940, load = 14.4 KB/s (44)

ts = 1285276941, load = 294.9 KB/s (764)

ts = 1285276942, load = 608.9 KB/s (1505)

ts = 1285276943, load = 1164.4 KB/s (2882)

ts = 1285276944, load = 1242.6 KB/s (3064)

ts = 1285276945, load = 1166.6 KB/s (2880)

ts = 1285276946, load = 69.9 KB/s (179)

ts = 1285276947, load = 140.1 KB/s (363)

ts = 1285276948, load = 139.9 KB/s (361)

ts = 1285276949, load = 139.7 KB/s (358)

ts = 1285276950, load = 139.7 KB/s (358)

ts = 1285276951, load = 139.3 KB/s (358)

....
It is a good test to see if the calculated payload is correct. The initial burst of ~1.2MB/s confirms that. 🙂